


“My Yet-To-Be Formalized Idea for Better Prediction”
Soya Hagiwara
University student (Advanced Science and Engineering, Department of Physics)
Japan

The pandemic will no doubt change the world as we know. And there are many speculations on how it is going to change. Many say the transition to digitalized economy accelerates, they also say centralization to big cities might reverse, etc. But nothing is for certain. Then, I thought ‘Machine learning may provide quite accurate prediction in certain domains where there are lot of past data. But what if we wanted make a prediction in other domains undergoing transformation?’. Let me give you a historical example of this problem.
If one could name the first quantitative and convincing prediction, that would be Malthus’ work. He stated that population increases geometrically, meaning the way it increases like a compound interest. On the other hand, he thought production of subsistence only grow in arithmetically, meaning its growth is like a simple interest. So, he concluded that the population inevitably outgrows subsistence, leading to large scale poverty.
However, this didn’t actually happen. The economic growth since the industrial revolution was so phenomenal that we actually got richer. What happened was that he couldn’t predict the rate at which economy can grow. He was possessed by the idea that economy can only grow in arithmetically, which is a quite reasonable assumption, if you had analyzed the data available at that time (18th century in England). Predicting the future from the past is erroneous, when groundbreaking shift is on the way.
Again, that’s the problem I was thinking. Can we still make a valid prediction, while such change is under way? If we can, how is it done? The solution that I thought is to, firstly, create a model that applies in the current state, secondly, calculate deviation of the real-word data from theoretical data, and lastly, spot the factor causing the deviation and adjust the model. In Malthus’ case, it is true that he failed in predicting the future, but he could have noticed the game-changing effect of industrial revolution by comparing the real-world data to his theory. And correct his theory, accordingly, making a more valid prediction.
Mere thought is nothing, the solution might turn out to be meaningless. I must pursue its possibility by actively practicing it. To do so, physics and programming may be helpful. They both presents a type of model which is applicable to the real-world.
Physics describe natural phenomenon with mathematical model. For example, there is an infection model called Kermack-McKendrick model (a.k.a. KM model). It is a system which consists of three variables: S, I and R. Each variable stands for the number of people who are susceptible to the disease, infected with the disease and recovered from the disease. In the model in its simplest form, these variables have the following relationship with one another.
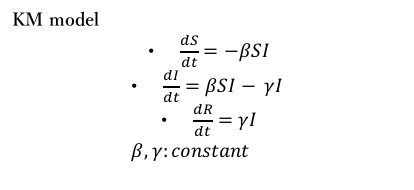
There are two fundamental change which occurs in a pandemic. One is people becoming sick. The rate at which susceptible person gets ill is thought to be proportional to S and I. (the more susceptible or infected people in a city, the more likely that a susceptible person meets the an infected person). Hence the first equation. The other fundamental change which occurs in epidemic is people recovering from infection. The rate at which this happen is thought to be proportional to I. Hence the third equation. The second equation is about the rate of change in I, so it is mixture of the two fundamental changes.
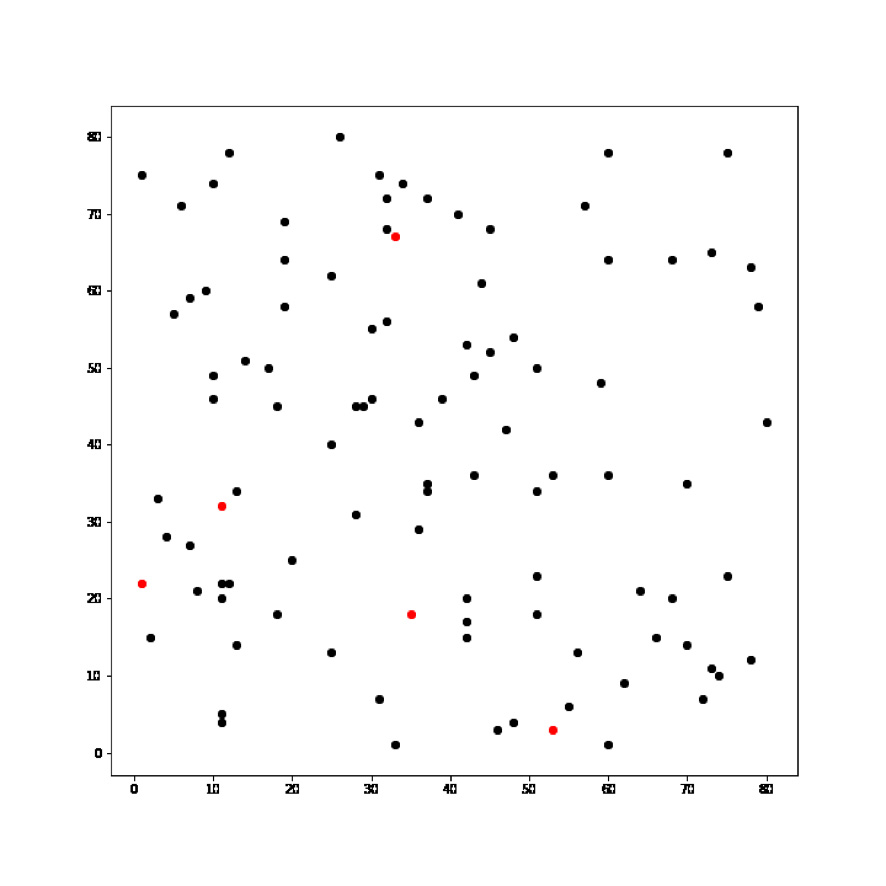
There are another type of model: Multi-Agent Simulation (a.k.a. MAS). MAS is a just set of rules, which will be run by a computer. For example, the image below is a simple simulation of infection with MAS. For this one used Python, a programming language.
Individual person is represented with a moving dot, and the colour indicates stage of infection. The structure of this simulation is quite simple. I just made the following rules and run the equivalent program on my computer.
- When a black dot (susceptible person) gets close enough to red dot (infected person), the black dot becomes infected.
- A red dot turns into a blue dot (recovered person) after a specific amount of time.
- Each dot moves at a constant speed.
- When a person hits the wall, he deflects in a random direction.
Thus far, we have seen two types of model: mathematical model and MAS. My idea is that we can detect the change in the real world, by calculating deviation of the real-world data from the theoretical data based on mathematical model and MAS. As for the examples of infection model which I presented, they cannot account for endemic, which is a situation where the disease constantly finds new hosts and therefore stably exits. They both always end up in explosive epidemic and the disease slowly gets eradicated as shown below, because it cannot find new susceptible hosts.
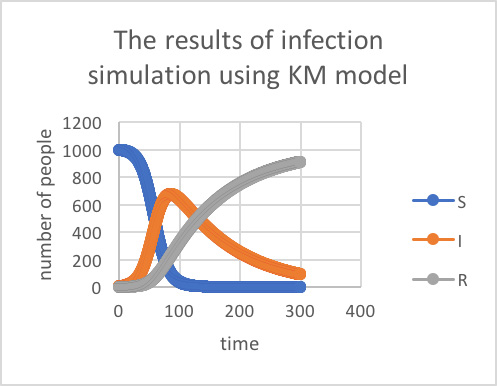
The graph on the left(or above on smartphone) is the result of infection simulation using Kermack-Mckendrick model. In order to simulate it in the computer, the difference equation version of KM model was used with the timestepΔt= 0.1. And conditions of the simulation were as follows:
β=0.0001, γ=0.01,
initial value of S=1000,
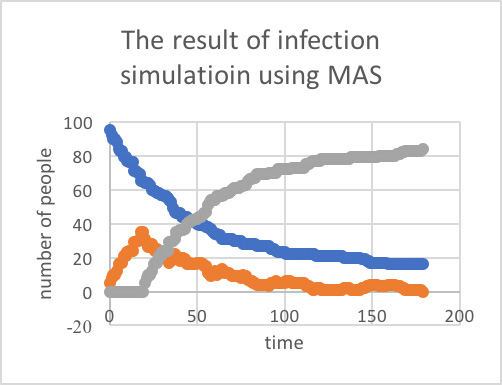
The graph on the left(or above on smartphone) is the result of infection simulation using MAS. And conditions of the simulation were as follows:
initial number of susceptible people=100,
initial number of infected people=5,
the size of the box where dots were trapped = 80*80,
infectious radius = 3,
the amount of time it takes to recover = 20
This contradiction makes us realize that the models are missing a crucial factor: constant refreshment of susceptible population due to immigrants or newborn child. In this way, we can spot a new factor in the real world, and adjust the model accordingly. This provides a power to predict the future, even in the situation where hardly any past data is available. And that’s the possibility I am going to pursue with the help of coding and physics.
パンデミックは間違いなく 私たちが知っている世界を変えるでしょう。そして、それがどのように変化していくのかについては、多くの憶測が飛び交っています。多くの人は、デジタル化された経済への移行が加速すると言い、大都市への中央集権化が逆転するかもしれないとも言っています。しかし、確かなことは何もありません。そのようなことから、「過去のデータが多い特定の領域では、機械学習でかなり正確な予測ができるかもしれない。しかし、過渡期にある他の領域で予測をしたいとしたらどうだろうか」と考えました。この問題の歴史的な例を挙げてみましょう。
最初の定量的で説得力のある予測を挙げるとすれば、それはマルサスが指摘したことになるでしょう。マルサスは、人口は幾何学的に増加する、つまり複利のように増加すると述べています。一方、マルサスは、生存のための生産は算術的にしか成長しないと考え、その成長は単純な利子のようなものだと考えていました。つまり、人口は必然的に人口を賄えるだけの食糧を超え、大規模な貧困に陥ると結論づけたのです。
しかし、実際にはそうはなりませんでした。産業革命以降の経済成長は驚異的で、実際に豊かになったのです。何が起こったかというと、マルサスは経済が成長する速度を予測できなかったのです。マルサスは「経済は算術的にしか成長しない」という考えに取り憑かれていたのですが、これは当時(18世紀のイギリス)のデータを分析していれば、かなり合理的な仮説です。画期的な変化が起きようとしている時に過去から未来を予測すると、間違った結果が出てしまうものです。
繰り返しになりますが、私が考えていた問題点はそこにあります。変化が起こっている最中であるにもかかわらず、有効な予測をすることができるのでしょうか? できるとしたら、どのようにできるのでしょうか? 私が考えた解決策は、まず、現状に当てはまるモデルを作成し、次に、理論データから実語データの乖離を計算し、最後に乖離の原因となっている要因にスポットを当ててモデルを調整することです。マルサスの場合、確かに未来予測は失敗しまたが、現実のデータと自分の理論を比較することで、産業革命の流れの変化に気づくことができてはずです。そして、それに応じて自分の理論を修正し、より有効な予測をすることができたはずです。
単に考えるだけでは何の解決にもなりません。頭の中だけでの解決策では何の意味もなさないのです。積極的に実践することで実際に解決策になり得るのかどうかを追及しなければなりません。そのためには、物理学やプログラミングが役に立つかもしれません。どちらも現実世界に適用可能な理論を提示しています。
物理学は自然現象を数学的な理論で表します。例えば、Kermack-McKendrickモデル(別名KMモデル)と呼ばれる感染症の症例数と予測を分布する仮説があります。KMモデルはS,IそしてRの3つの変数からなるシステムです。各変数は、病気にかかりやすい人、病気に感染した人、病気から回復した人の数を表しています。最も簡素化された理論では、これらの変数は互いに次のような関係を持っています。
パンデミックで起こる2つの基本的な変化があります。一つは、人々が病気になることです。感染しやすい人が病気になる率は、SとIに比例すると考えられています(都市の中で感染しやすい人や感染者が多ければ多いほど、感染しやすい人と感染者が出会う確率が高くなります)伝染病で起こるもう一つの基本的な変化は、人々が感染から回復することです。これが起こる率はIに比例すると考えられています。2番目の式はIの変化率についてのものなので、2つの基本的な変化の混合物です。
モデルの別のタイプがあります。マルチエージェント・シミュレーション(別名MAS)。MASは単に決まり事がセットになったもので、コンピュータが実行することになります。たとえば、下の画像は、MASと感染の単純なシミュレーションです。ご覧の表に関しては、Python(プログラミング言語)を使用しています。
個々の人は動く点で表現され、色は感染の段階を示します。このシミュレーションの構造は非常に簡易的なものです。以下のような決まり事を作り、それに相当するプログラムをコンピュータで実行しただけのものです。
- 黒い点(感染しやすい人)が赤い点(感染している人)に近づくと、黒い点が感染します。
- 赤い点は一定時間後に青い点(回復した人)に変わります。
- それぞれの点は一定の速度で移動します。
- 人は壁にぶつかるとランダムな方向に偏向します。
ここまでで、数学的理論とMASの2種類の理論を見てきました。私の考えは、数理理論とMASをもとに、理論データから実世界のデータの偏差を計算することで、実世界の変化を検出できるというものです。今回紹介した感染モデルの例では、常に新しいターゲットを見つけては、安定的に逃げていくような風土病を説明することはできません。どちらも常に爆発的な流行に終始し、新しいターゲットを見つけられないために以下のようにゆっくりと根絶されていくのです。
The graph on the left(or above on smartphone) is the result of infection simulation using Kermack-Mckendrick model. In order to simulate it in the computer, the difference equation version of KM model was used with the timestepΔt= 0.1. And conditions of the simulation were as follows:
β=0.0001, γ=0.01,
initial value of S=1000,
The graph on the left(or above on smartphone) is the result of infection simulation using MAS. And conditions of the simulation were as follows:
initial number of susceptible people=100,
initial number of infected people=5,
the size of the box where dots were trapped = 80*80,
infectious radius = 3,
the amount of time it takes to recover = 20
この矛盾は、この理論が重要な要素を欠いていることに気づかせてくれます:移民や新生児など感染リスクの高い集団に対する定期的な更新です。このようにして、現実世界での新たな要因を発見し、それに応じて理論を調整することができます。これは、過去のデータがほとんどない状況でも、未来を予測する力を与えてくれます。そしてそれは、私がコーディングと物理学の力を借りて追求しようとしているそのものなのです。